
Analyze · Causal & Impact
Stop reporting the number. Move it.
Most analytics tell you what happened. Celeredge tells you why — and what to change. Causal inference on your client's own data, grounded in the industry ontology.
Estimating causal effects across 38 tables — live.
From correlation to decision.
Three steps, one workflow.
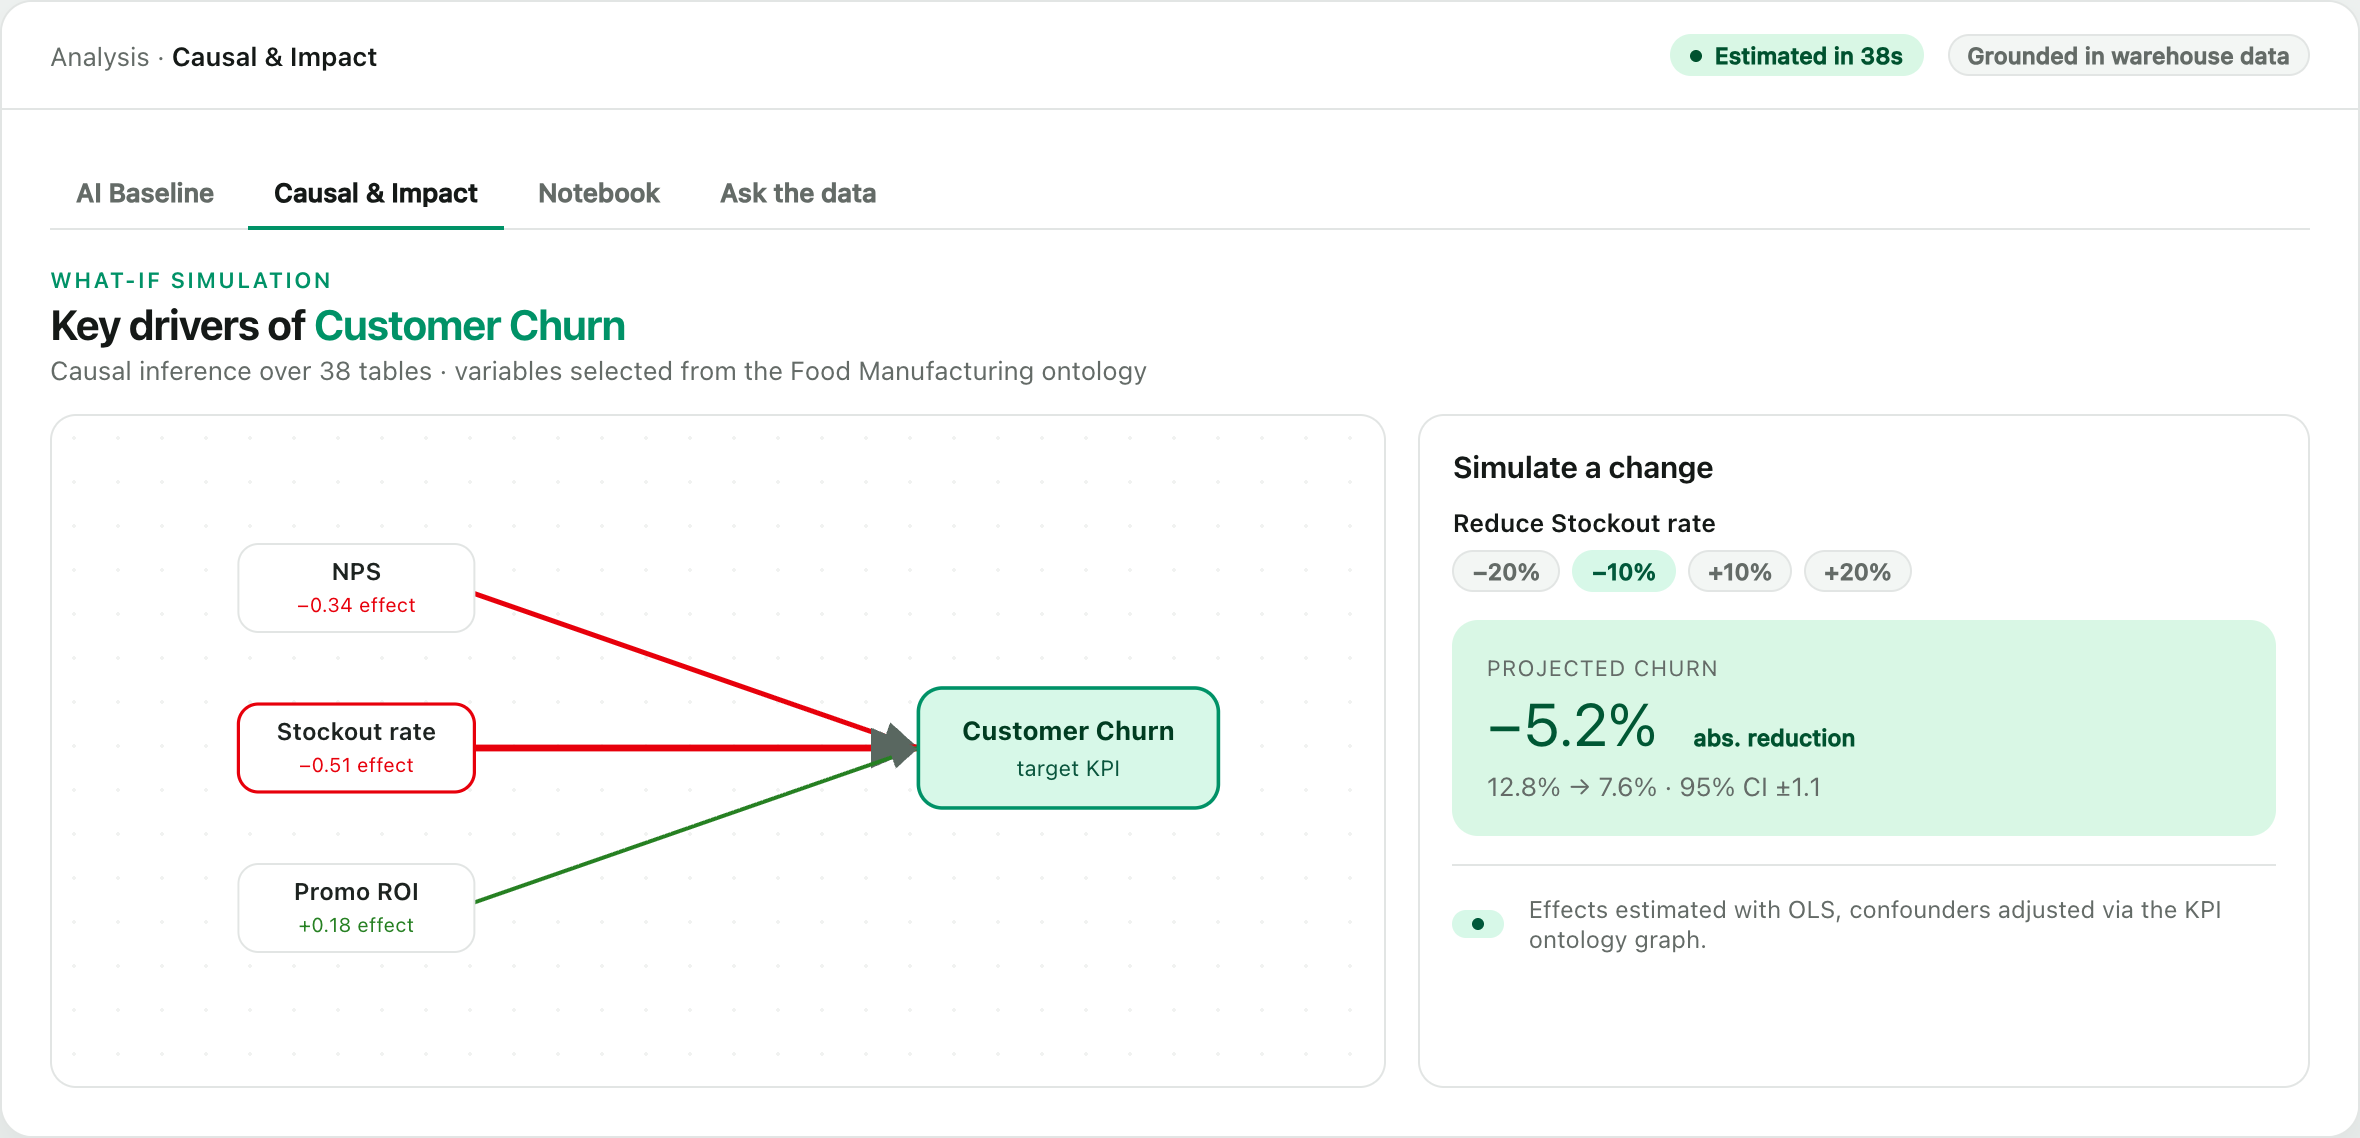
1 · Discover drivers
Identify the variables that genuinely move a target KPI — drawn from the ontology graph, not guessed.
2 · Estimate effect
OLS estimation with confounders adjusted via the KPI graph, returning an effect size and confidence interval.
3 · Simulate impact
"Cut stockouts by 10%?" — see the projected change in the outcome before you commit a recommendation.
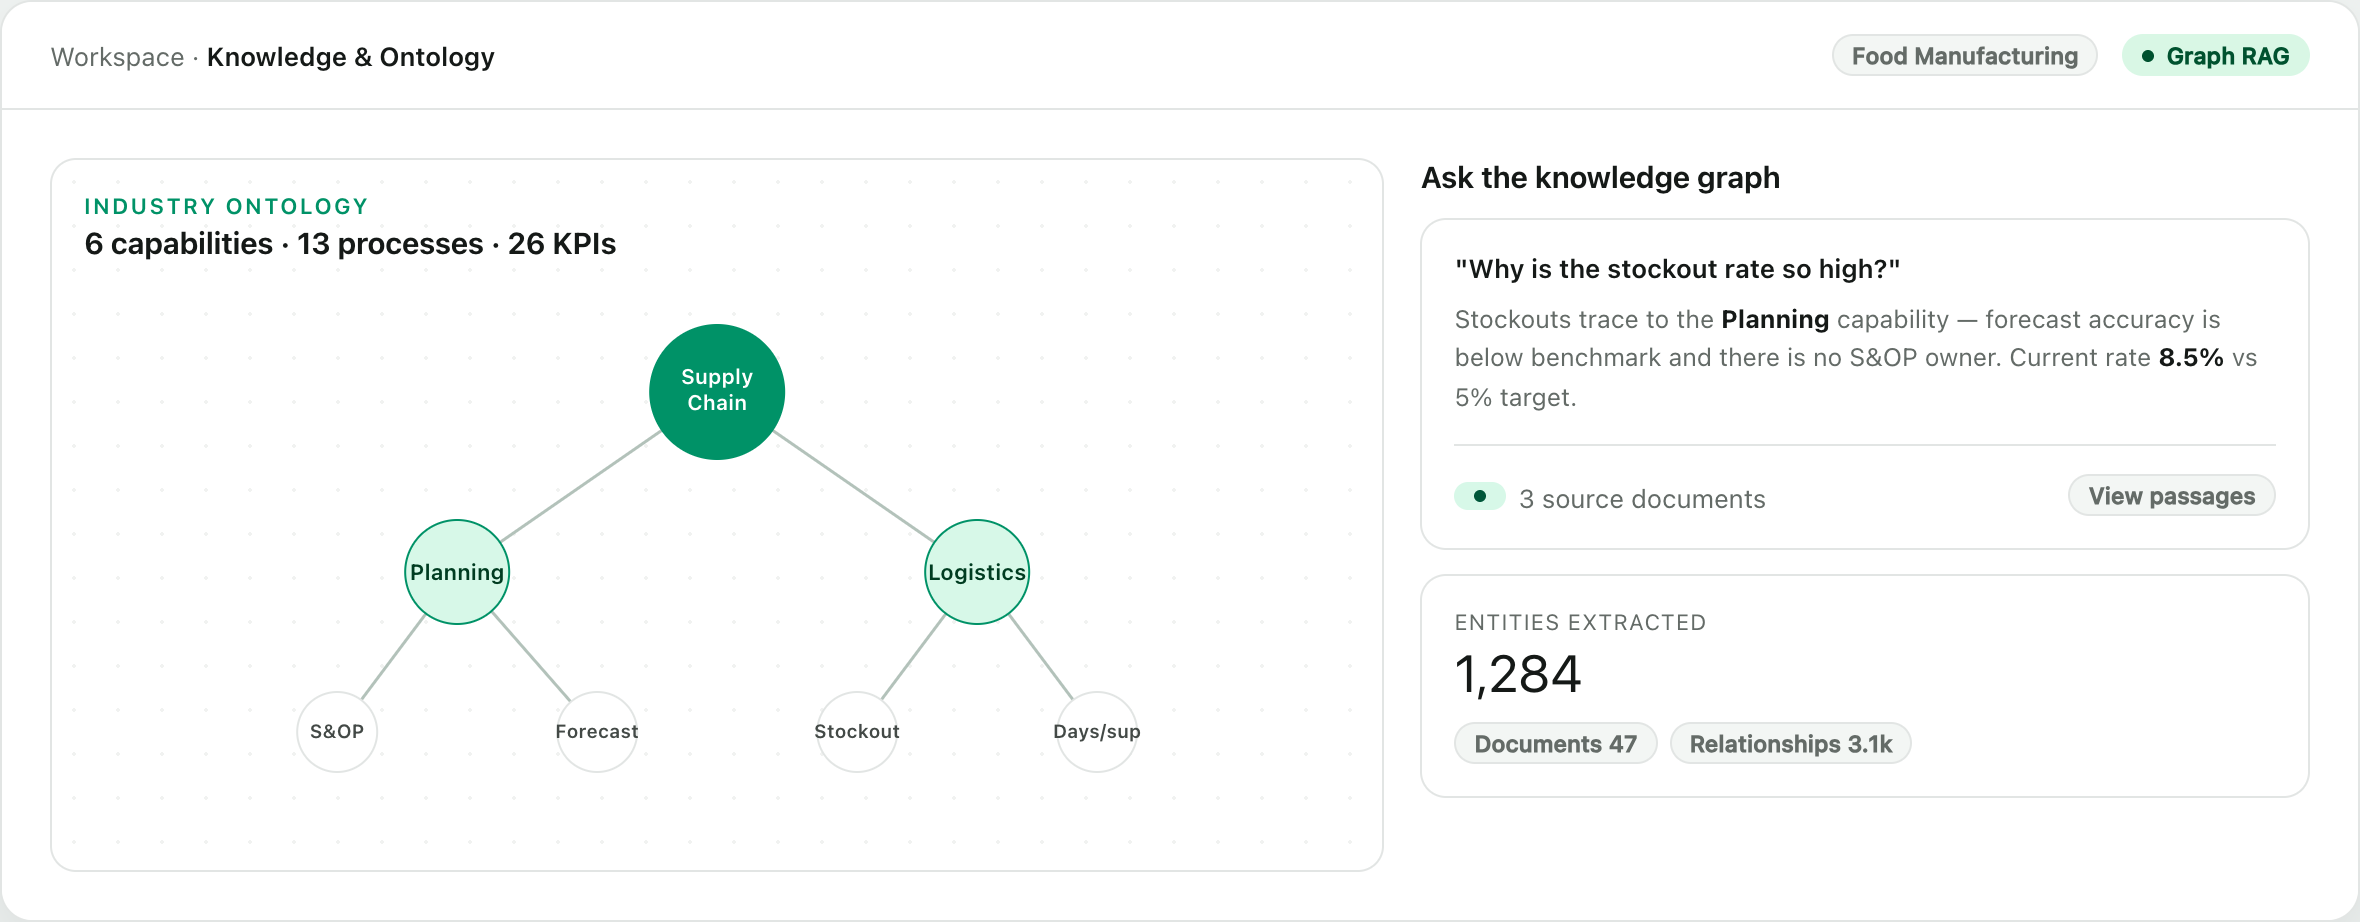
Grounded, not guessed
Reasoning over real data.
The analysis connects to your client's warehouse and reasons over actual metrics — NPS, stockout rate, promo ROI, days of supply — not a generic template.
- Variable selection traverses the industry ontology
- Results cached per engagement, connection and KPI
- Streaming progress while the model runs — no black box
Bring a dataset. Leave with a decision.
We'll run a live causal simulation on a KPI that matters to you.